
“Are expense ratios an important factor when evaluating closed-end funds (CEFs) for investment?” We field this question often, as most investors (and even investment professionals) assume that higher expense ratios inevitably lead to lower future returns for any given CEF. And this assumption is not baseless. In fact, we believe (and most studies would show) that expense ratios are meaningful when evaluating open-end mutual funds and ETFs for investment.
Consider that the median management fee for a CEF is 0.75% today, while the median annual report net expense ratio for a CEF is more than double that at 1.52%. Most investors don’t understand that this latter figure is required to include the cost of any leverage (for CEFs which utilize leverage), and it doesn’t truly reflect the management fees that are paid to a CEF manager.
Candidly, some investors consider CEF expenses too high because of this, and ultimately avoid them. However, our research on CEF expense ratios and their correlation to total return may surprise you.
The Quick Answer
Our research indicates that there is virtually no correlation between CEF expense ratios and their subsequent total returns over the past decade. On this basis, we can confidently conclude that expense ratios are not statistically significant predictors of total return for CEFs. This research conclusion is counterintuitive and goes against most conventional investing wisdom.
So, what is a statistically meaningful factor when evaluating CEFs for investment?
Answer: Starting discount levels.
Over the past decade, our research indicates that there is considerable correlation between CEF starting discount levels and their subsequent total returns. For example, the median calendar year return for a CEF whose beginning-of-year discount landed in the most discounted quintile of the overall dataset was 18.26%… more than 11 percentage points higher than the 6.87% median calendar year return for all other starting discount quintiles. This is statistically significant, but not a surprise to us. As our followers know, this simply reemphasizes the conclusions we drew from the University of Oregon Study more than a decade ago.
The Long Answer
We recently examined the year-by-year calendar returns for all active CEFs over the past decade (from January 1st, 2011, to December 31st, 2021). Further, we modeled and analyzed these returns in relation to each CEF’s individual expense ratio to determine if there was any significant relationship between CEF expense ratios and their subsequent total return.
We started by grouping the CEF universe into quintiles (or fifths), grouping the most expensive CEFs together (highest quintile expense), least expensive CEFs together (lowest quintile expense), and so on. From there, we analyzed each CEF quintile separately and computed a correlation figure for the relationship between expense and return.
Here’s what we found.
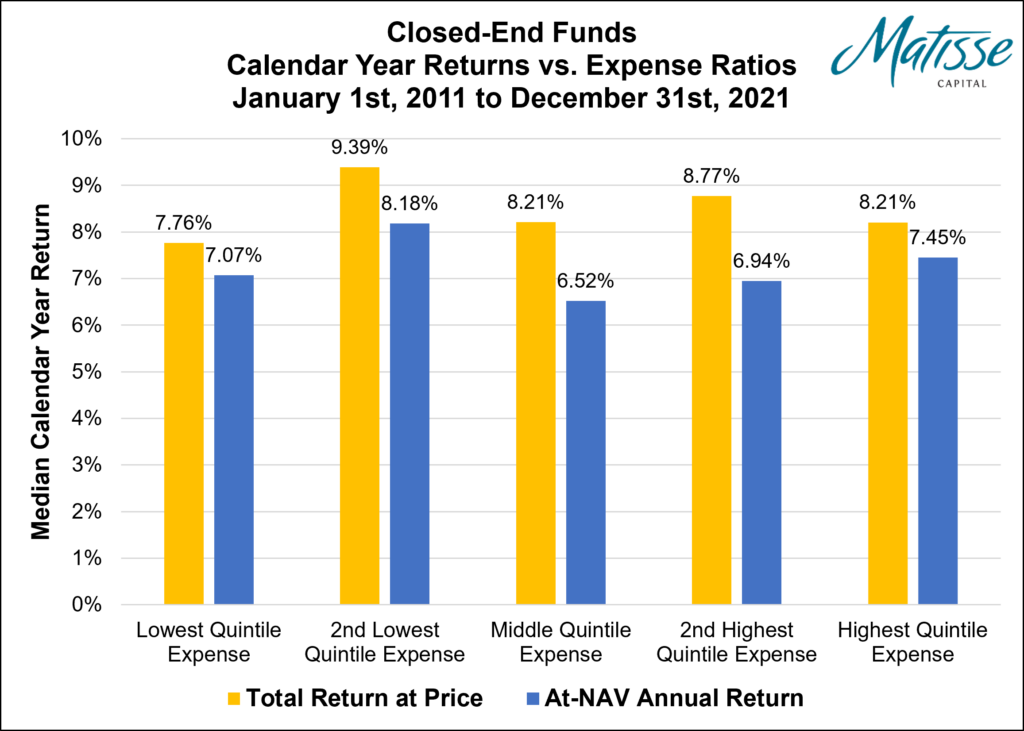
Over the time period studied (1/1/2011 to 12/31/2021):
- CEF expense ratios were approximately 3% correlated with at-NAV returns.
- Higher expenses were slightly correlated with lower at-NAV returns.
- However, the highest quintile of expense ratios had a higher median annual return than the lowest quintile of expense ratios!
- CEF expense ratios were approximately 4% correlated with total returns at price.
- Higher expenses were slightly correlated with lower total returns at price.
- However, the highest quintile of expense ratios had a higher median annual return than the lowest quintile of expense ratios!
What does this tell us? First, a 3% or 4% correlation is very insignificant. A correlation this close to zero tells us that there is virtually no relationship between the variables measured (in this case, the expense ratios of each CEF and their subsequent total return). Our conclusion is that CEF expense ratios have virtually no predictability or influence on their subsequent total returns. We believe investors should largely ignore expense ratios when selecting CEFs (or CEF strategies) for investment.
So, what should investors be looking at when evaluating CEFs for investment?
Using the same dataset and time period, we did a similar exercise but looked at starting discount levels instead of expense ratios. We again divided the CEF universe into quintiles (or fifths), grouping the most discounted CEFs together (most discounted quintile), least discounted CEFs together (least discounted quintile), and so on. Finally, we computed the median return for the CEFs within each quintile.
Here’s what we found.
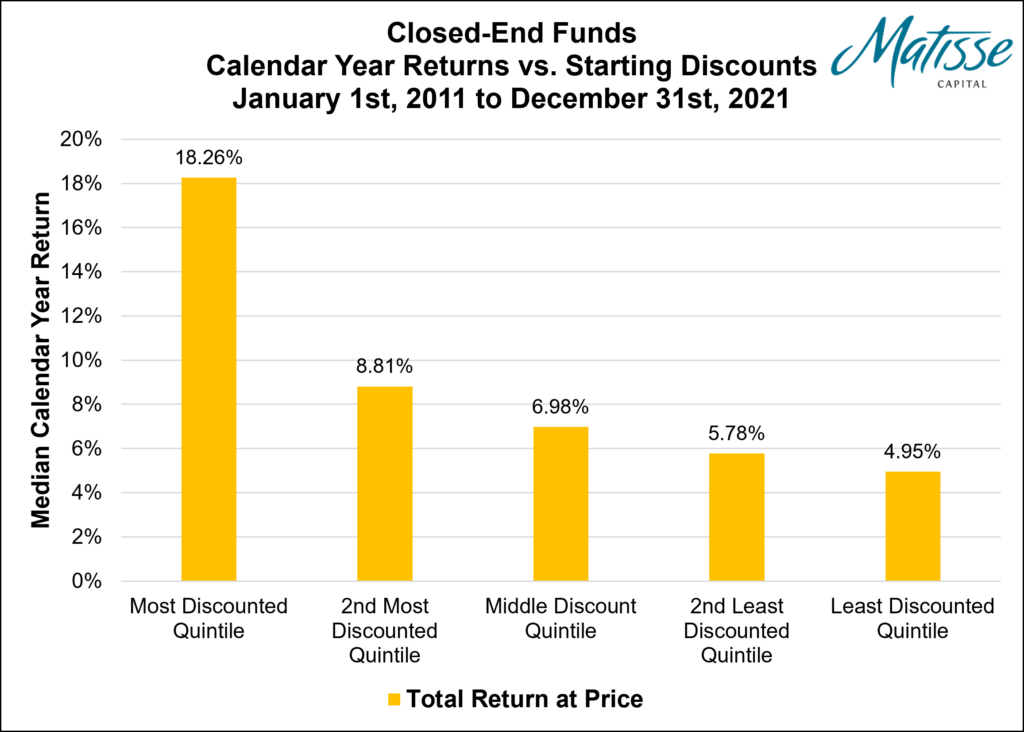
Note that there is strong evidence of a linear relationship, where the most discounted quintile produces the highest total returns over the time period, and each subsequent quintile produces lower and lower returns.
What does this tell us? It indicates that there is a significant relationship between CEF starting discount levels and subsequent total returns. Our conclusion is that starting discount levels in CEFs have meaningful predictive power and influence on their subsequent total returns. If investors are evaluating CEFs (or CEF strategies) for investment, we strongly believe they should focus their attention on current discounts.
The income strategies we employ in our mutual funds primarily focus on and target highly discounted CEFs for investment. To learn more, visit Matisse Funds.
Disclosures and Methodology
For the charts presented above: the list of CEFs used in our dataset was sourced from Morningstar, and represents all currently active CEFs (as of 9/13/22). This list remained static for the time period studied. The expense ratios used in our study represent the current expense ratios of each CEF today, and were sourced from Morningstar. These expense ratios were assumed to have remained static for the time period studied. The total returns for each CEF were sourced from Bloomberg.
The opinions expressed herein are those of Matisse Capital and may not actually come to pass. This information is believed to be current as of the date of this material and is subject to change at any time, based on market and other conditions. Although taken from reliable sources, Matisse Capital cannot guarantee the accuracy of the information received from third parties. This information does not constitute a solicitation nor an offer to buy or sell any securities.